
1. Introduction
Suspension hardpoints (HPs), also referred to as nodes, are the 3D coordinates of all the key attachment and reference points that define a vehicle’s suspension geometry. Most of these are the “pick-up points” where arms, links, dampers, springs, anti-roll bars, steering links connect to the chassis, subframe, upright (knuckle), or each other. Others (such as the wheel centre) are reference points used to describe the suspension geometry.
Hardpoints are mathematical points in space defined in a global coordinate system (X, Y, Z), such as:
• X: longitudinal (forward/backward)
• Y: lateral (left/right)
• Z: vertical (up/down)
In a previous article, “How to Measure Suspension Hardpoints on a Vehicle” we presented how to measure HPs on a vehicle. In this article we show why HPs accuracy matters by looking at how small changes affect the suspension key performance indicators (KPIs).
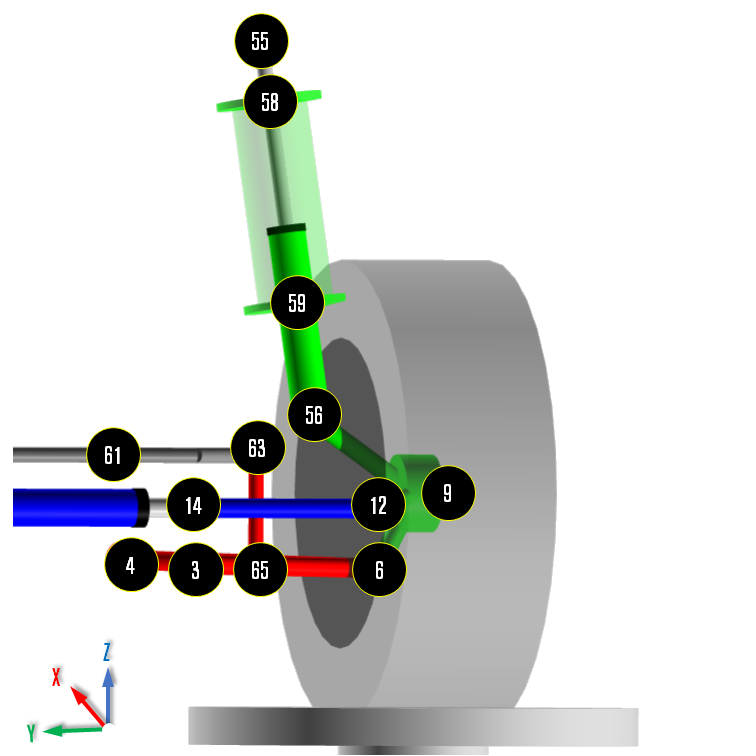
MacPherson Suspension HPs (Left Wheel/Front View) – Example
2. Why HP accuracy matter
Suspension kinematics are driven by geometry: the HP positions define the wheel path and how the wheel position and angles (camber, toe, castor, etc.) change with bump/rebound, roll and steer. If the HP coordinates are wrong, the kinematic behaviour you calculate will also be wrong.
In real vehicles, the “as-built” geometry is rarely identical to a CAD model. Manufacturing tolerances, assembly variation and component changes (uprights, brackets, subframes, repairs, spacers) all introduce small deviations that can be enough to shift the measured kinematics.
A few millimetres of error at a single HP can influence tens of derived suspension KPIs. This is why the measurement method matters: in the workshop you measure the geometry of real parts (for example the centre of a joint/bush or the centre of a mounting hole) and then convert those into HP X, Y, Z coordinates. Any error in locating these centres, or in precisely converting them into HP coordinates, will carry directly into the suspension model and change the KPI results you calculate.
Under braking/acceleration and cornering loads, compliance deflections change the effective geometry. Correlation therefore needs both accurate HPs and realistic stiffness inputs. This is usually more critical in passenger cars with softer rubber bushes than in race cars with ball joints or very stiff bushes.
3. Study scope and setup
As there are so many possible combinations of HP changes and performance metrics, this article focuses on two simple case studies:
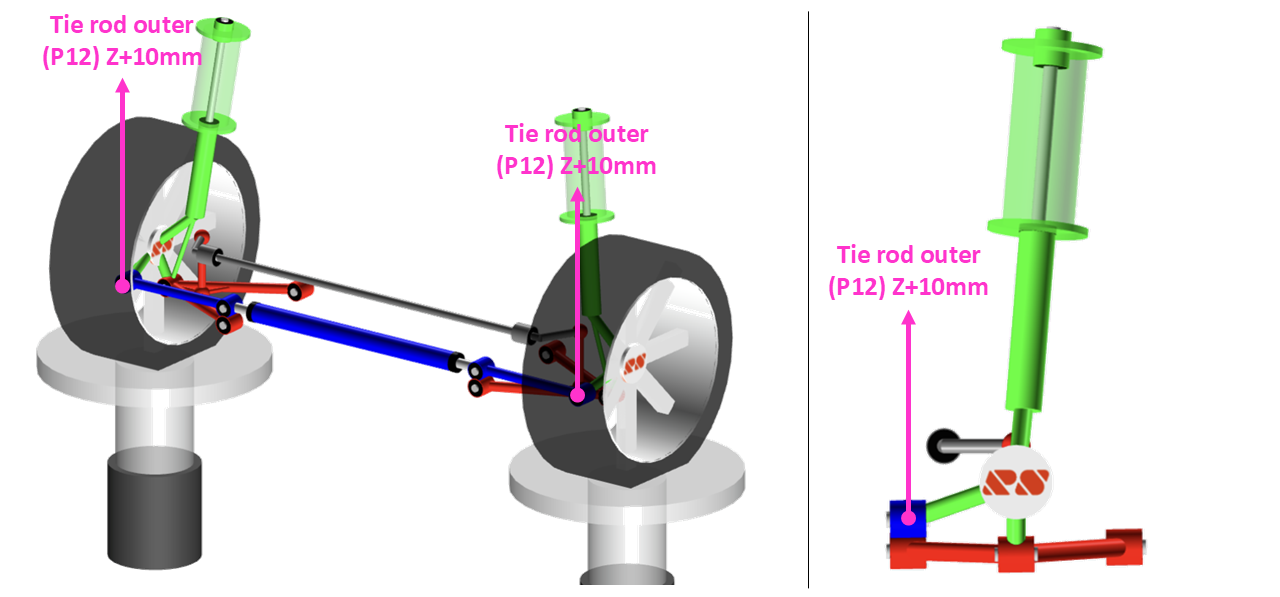
• Study 1: moving the outer tie rod (track rod / toe link) joint 10 mm (1 cm) upwards /+Z (P12 in RACE Software)
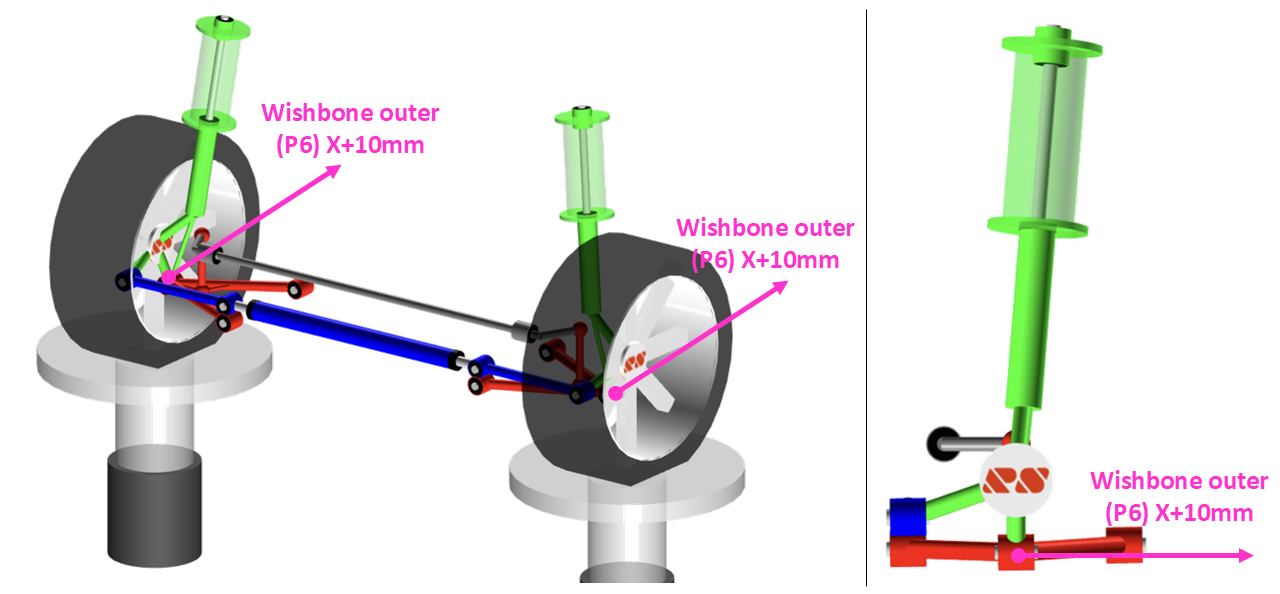
• Study 2: moving the outer wishbone joint 10 mm rearwards/+X (P6 in RACE Software)
For each case, we list all KPIs where the change exceeds 25%. The discussion then focuses on one representative KPI per case, chosen for vehicle behaviour relevance rather than percentage change. The full KPI comparison reports can be downloaded at the bottom of the page.
The study is run on a generic front MacPherson suspension system found typically in a hatchback vehicle, however, the same principles apply to other axle types. Each case is evaluated in RACE Software using a full virtual kinematics and compliance (K&C) test suite, including vertical (bounce) motion, roll motion, steering input, lateral (cornering) force, longitudinal force (braking and traction), and tyre aligning torque.
For this study, all other parameters are kept identical to the baseline configuration (bush/joint stiffnesses, masses, wheel properties, and spring/damper assembly settings).
The two changes are evaluated separately (not cumulative). Each modified case is compared directly to the same baseline geometry.
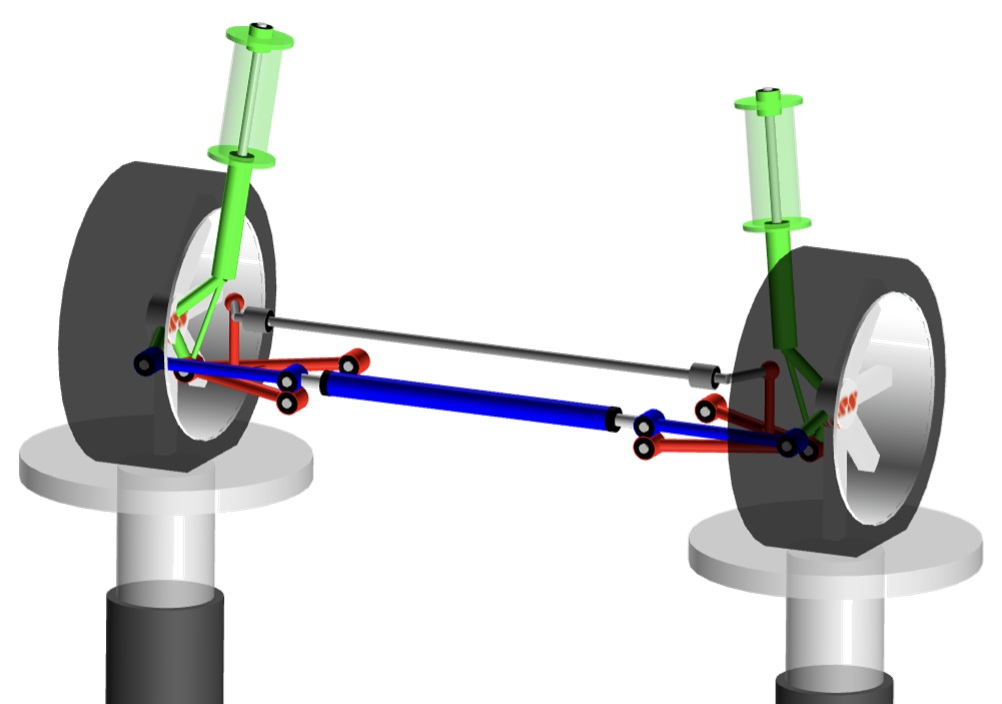
MacPherson suspension RACE Software Advanced
4. Case study 1 – outer tie rod joint +10 mm upwards (P12+Z10)
| Baseline | P12+Z10 | Difference | ||
| Roll steer – on centre | deg/m | -5.5 | 5.6 | 202% |
| Roll steer – 25mm bump | deg/m | -4.8 | 6.5 | 235% |
| Roll steer – 25mm rebound | deg/m | -6.8 | 4.3 | 163% |
| Front anti-lift | deg | 0.2 | 1 | 400% |
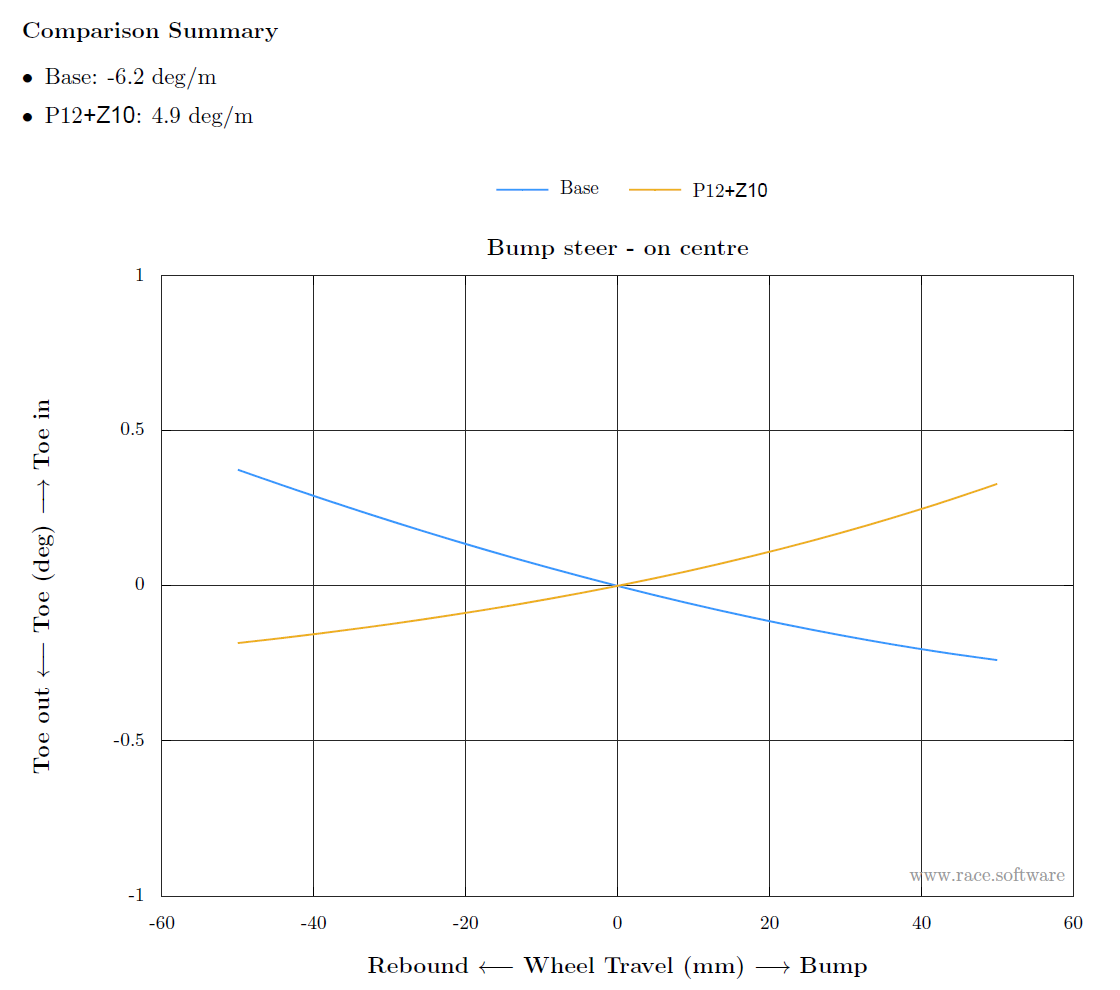
| Bump steer – on centre | deg/m | -6.2 | 4.9 | 179% |
| Bump steer – 25mm bump | deg/m | -4.8 | 6.5 | 235% |
| Bump steer – 25mm rebound | deg/m | -7.5 | 3.6 | 148% |
| Kinematic wheel centre recession | mm/m | -4 | -17.5 | -338% |
Raising the outer tie rod joint by 10 mm affects almost 30 KPIs. Some of the changes to KPI’s are negligible, some are minor but there is a major change to the suspension bump steer (and the same sensitivity applies to roll steer). In this study, the bump steer (video) sensitivity is +1.1 deg/m per 1 mm of upward movement, so every 1mm of measurement error on the hardpoints, will give a bump steer error of 1.1 Deg/m.
To put the +11.1 Deg/m bump steer error due to the 10mm hardpoint measurement error in context, let’s consider typical levels of bump steer used on the front suspension of passenger vehicles. Vehicle manufacturers would aim to have some amount of toe-out when the suspension moves into bump. This is an understeer tendency and is an aspect of suspension performance which is tuned during vehicle dynamics development. If a survey was taken to measure the levels of front bump steer used by vehicle manufacturers on front suspension of passenger cars, the results would show that most vehicles would fall in a range between about 0 Deg/m to -12 Deg/m. Therefore the error we have in our simulation due to the 10mm measurement error of Pt12 Z is almost equal to the full range of bump steers used by vehicle manufacturers on front suspensions. This is a considerable error in the model.
Vertical test
Bump steer – on centre
5. Case study 2 – wishbone outer joint +10 mm rearwards (P6+X10)
| Baseline | P6+X10 | Difference | ||
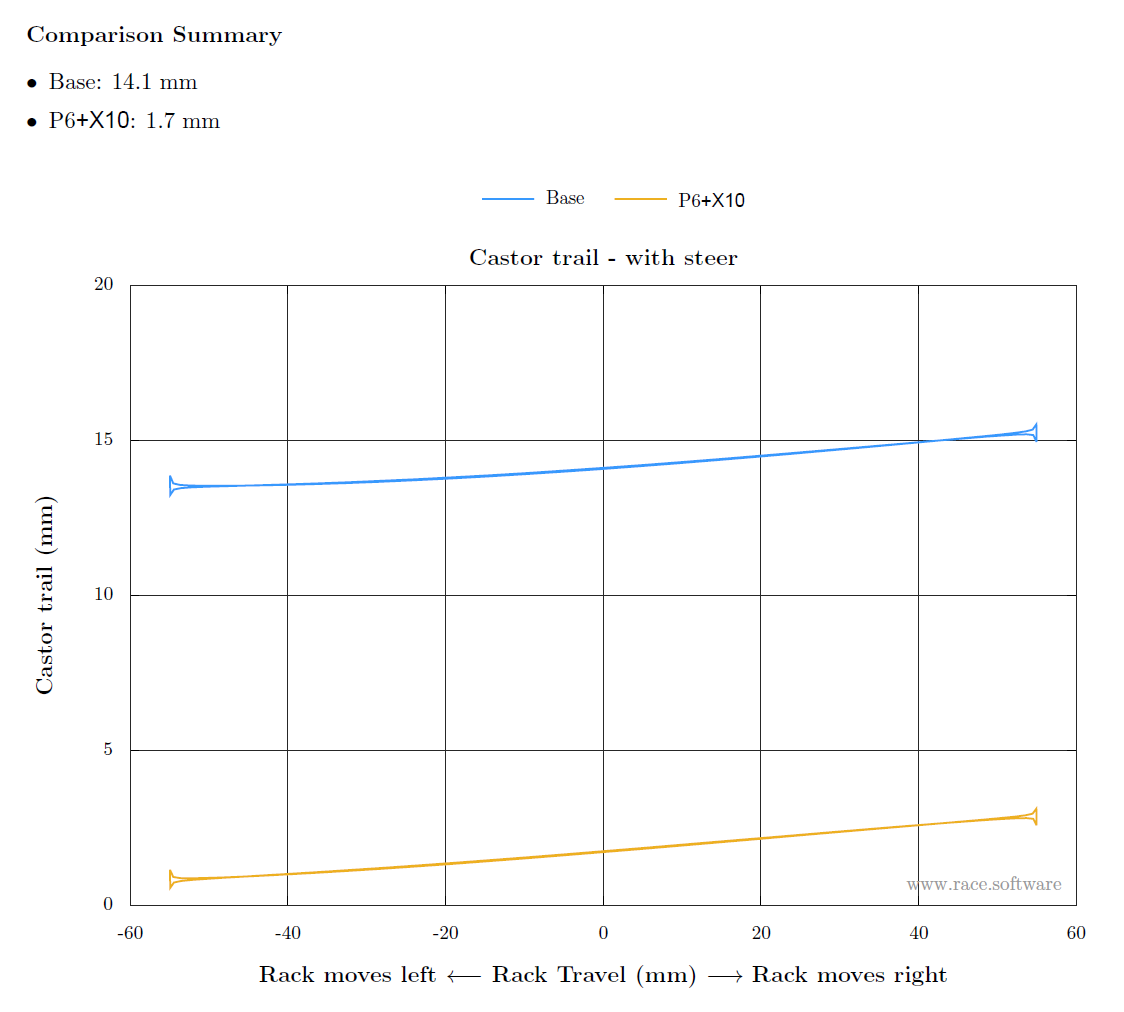
| Castor trail | mm | 14.1 | 1.7 | 88% |
| Wheel centre longitudinal offset | mm | -7.8 | -15.9 | -104% |
| Static toelink load | N | -93.9 | -26.2 | 72% |
| Front anti-lift | deg | 0.2 | 0.3 | 50% |
Moving the outer ball joint of the lower control arm 10 mm rearwards affects over 20 KPIs. As seen in case study 1, some of the changes to KPI’s are negligible, some are minor but in this case there is a major change to the suspension castor trail. For every 1mm of Pt6 X hardpoint measurement error, we see a change of 1.2 mm of castor trail. Castor trail is an important suspension KPI as it contributes to steering feel and feedback to the driver when cornering. It also contributes to vehicle stability by providing a level of steering wheel self-centering when the wheel is steered away from centre.
Vehicle manufacturers will carefully set the level of castor trail in a suspension to match the characteristics of their vehicle. To put the 12.4mm error into context, consider that vehicle manufactures typically tune the castor trail on a suspension to sit somewhere in the range of about 12mm to 35mm. This is a total range of 23mm. The error from the hardpoint measurement in this case study is therefore 54% of the total range of castor trail values used on all types of front suspensions. Again, this is a considerable error in the model.
Steering test
Castor trail – with steer
6. Conclusions
The two basic case studies in this article highlight the importance of having the correct coordinates for each HP. In reality, you would expect deviations in X, Y and Z across multiple HPs at the same time, and the combined effect can be larger than the isolated examples shown here.
The full study outputs for both cases can be downloaded here: