Background
This case study looks at how lowering the ride height of a car and increasing its track width impacts suspension performance. Suspension performance analysis (also known as suspension kinematics and compliance or K&C analysis) is the study of how a suspension system reacts to the forces and moments it experiences during driving.
Lowering the ride height of a car and increasing its track width are two common modifications done by car enthusiasts. These modifications are often done with the goal of improving the car’s driving performance or the car’s ‘stance‘, on a fast-road or track car for example. The idea being to lower the centre of gravity of the car and increase its track width to mimic the setups commonly seen on race cars.
This study uses multibody simulation (MBS) also referred to as multibody dynamics (MBD) to simulate a suspension and assess its performance. This is a common automotive and motorsport industry approach used during suspension development. Using this analysis, the differences between an unmodified suspension and a lowered suspension are shown and discussed.

Figure 1. Examples of Cars with Lowered Suspensions/Shorter Springs and Spacers also known as “Stanced”
Suspension Analysis Overview
A set of front suspension hardpoints (key positions in a suspension, e.g. joint positions, damper position, wheel position, etc.) measured from a current generation European hatchback are used for this study. The car has a MacPherson strut suspension, a widely used front suspension type on many different vehicles. The suspension is analysed using RACE Software’s cloud multibody simulation (MBS) platform. RACE Software runs a suspension kinematics and compliance (K&C) analysis on a model of the suspension. Kinematics is concerned with the motion of the suspension during vertical travel, roll and steering. Compliance looks at the reaction of the suspension to braking forces, traction forces, cornering forces and tyre moments. The output of the analysis is a suspension key performance indicator (KPI) report which looks at the performance of the suspension against 54 automotive industry standard KPIs.
The RACE Software MacPherson strut model is shown in Figure 2. Two configurations of the MacPherson strut model are run for this study:
- Baseline analysis: the front suspension in its unmodified condition
- Lowered analysis: the front suspension with the ride height lowered 50mm/2 inches and the track width increased by 40mm/1.6 inches (using wheel offsets or wheel spacers)
Tyres, springs and dampers are not considered as these are stand alone modifications which can be made regardless of ride height and wheel fitment.
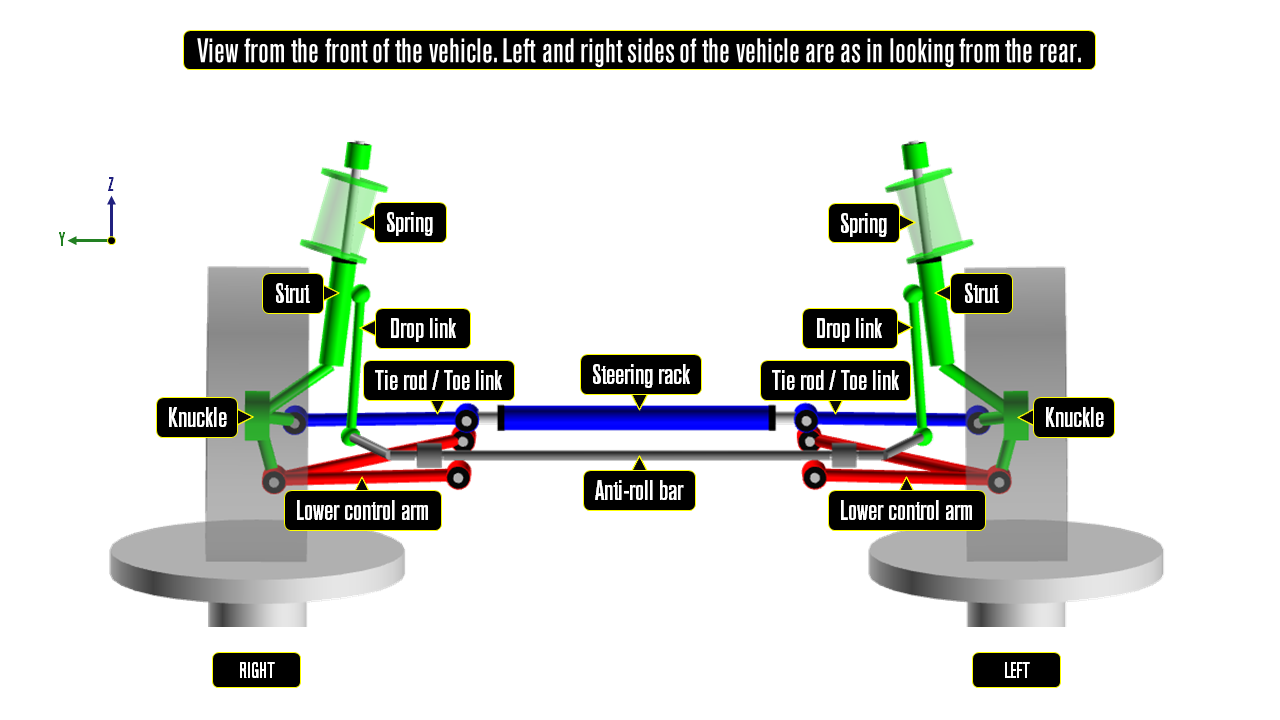
Figure 2. RACE Software MacPherson Strut – Suspension Components
Suspension Performance Results
A comparison of the K&C results for the baseline car and the lowered car highlighted seven key differences between the two setups. The key differences are summarised in table 1 and discussed below.
| KPI name | KPI unit | Baseline KPI | Lowered KPI |
| Static Toe | Deg | 0.00 | -0.42 |
| Static Camber | Deg | -0.53 | -0.82 |
| Wheel centre lateral offset | mm | 67 | 87 |
| Bump camber | Deg/m | -11.4 | 1.1 |
| Bump steer | Deg/m | -6.8 | -12.4 |
| Roll centre height | mm | 45 | -90 |
| Contact patch stiffness | N/mm | 1727 | 1595 |
Table 1. Key KPI Differences Between the Baseline and Lowered Analyses
The manufacturer’s specification for this car specifies zero static toe on the front suspension with a tolerance range of +/- 0.08 Deg. The lowered car is far outside this range with a toe value of -0.42 Deg (negative is toe-out, meaning the front of the wheel is pointing away from the centre of the vehicle). If left uncorrected this would be noticeable to most drivers. The lowered vehicle’s initial turn-in response would be slower and less sharp than the baseline. In addition, the high levels of toe-out on the lowered car would contribute to greater path deviations when the car is subject to external influences such as cross winds. It would also result in significantly accelerated tyre wear.
The static camber change from -0.53 Degrees to -0.82 Degrees is a beneficial one for anyone chasing improved handling. It is just outside the manufacturers recommended tolerance range and is unlikely to cause any significant issues. In isolation, it will increase the cornering potential of the vehicle by reducing the levels of positive camber seen on the outside wheel (the wheel furthest from the corner apex) during cornering.
The wheel centre lateral offset is the distance from the wheel centre line to the steering axis of the knuckle as shown in Figure 3.
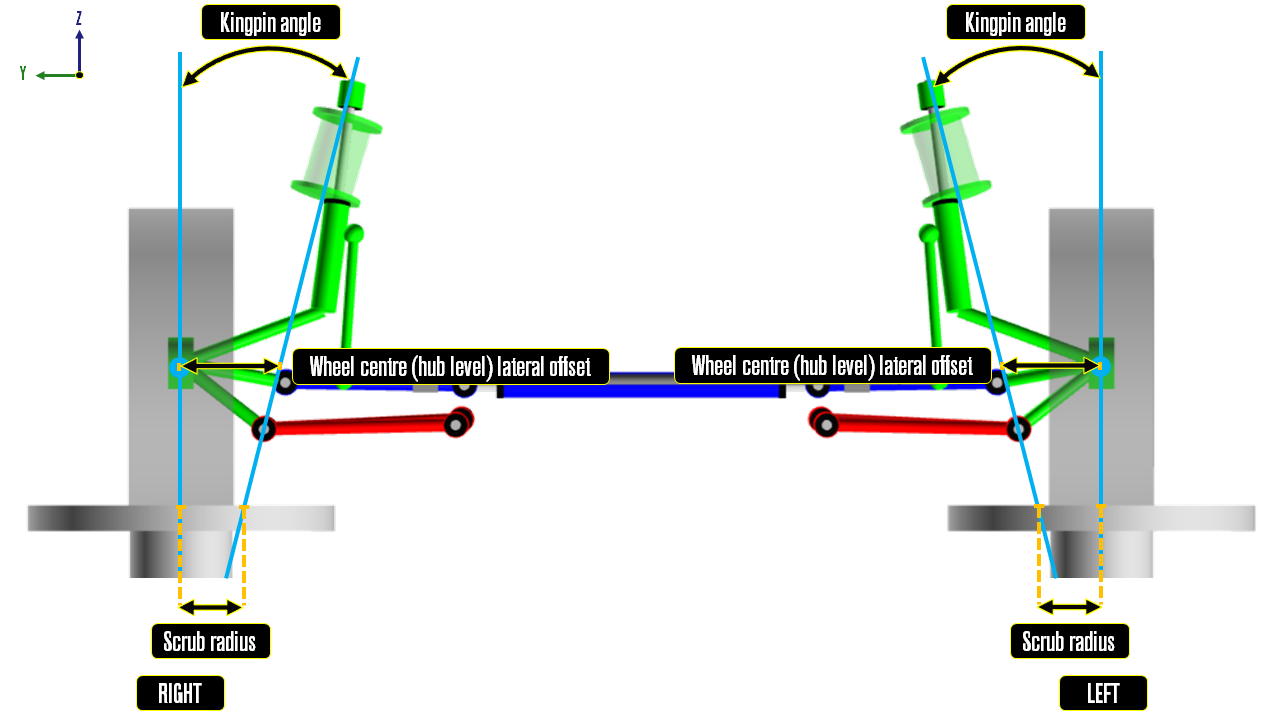
Figure 3. MacPherson Strut – Wheel Centre Lateral Offset, Scrub Radius and Kingpin Angle
The 40mm track width increase due to the wheel offset modifications results in a 20mm wheel centre lateral offset increase each side. At 67mm the baseline is inline with typical values for a MacPherson strut with the lowered car at 87mm being beyond what most vehicle manufacturers would accept in a suspension design. High levels of wheel centre offset result in steering corruption (unwanted forces and moments feeding back to the steering wheel). The corruption comes from torque steer, brake judder, steering kickback and/or wheel/tyre imbalance. All are exaggerated by increased wheel centre lateral offsets. It is this KPI which car manufacturers are aiming to reduce when they fit ‘Revo’ type knuckles to their high power front wheel drive cars, typically hot hatches like the Ford Focus RS and Honda Civic Type R. Although not captured in this metric directly, the wheel modifications will also increase the loading on suspension system wheel bearings and joints, resulting in increased wear and reduced life.
Bump camber shows a significant change between the baseline and the lowered car. The bump camber curve of the baseline vehicle is shown in Figure 4. Note the nonlinearity in the bump camber curve, this is a typical characteristic for a MacPherson strut suspension. The negative value of -11.4 Deg/m for the baseline means that the tyre gains negative camber as it moves into bump.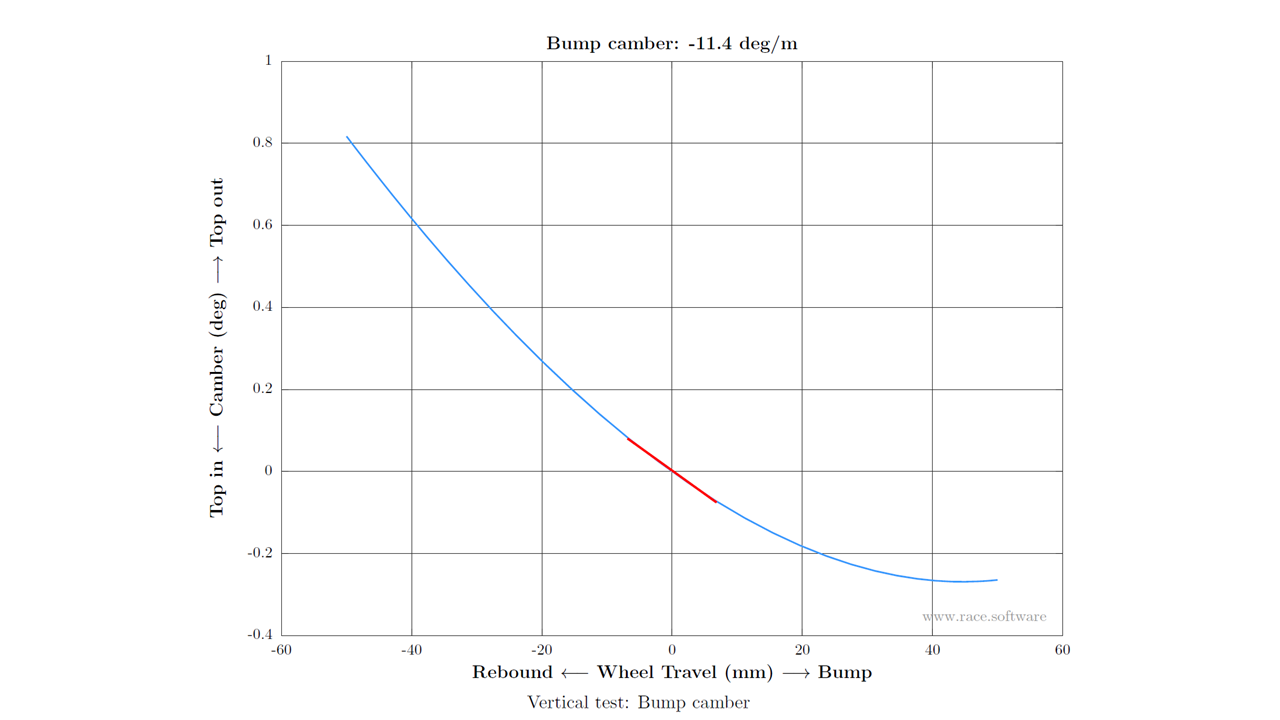
Figure 4. RACE Software – Baseline Report – Bump Camber
This is beneficial on a vehicle as this bump camber, or ‘camber gain’ as it is commonly known, compensates for the positive camber experienced by the heavily loaded outside wheel when cornering. When a vehicle corners, the forces acting on the centre of gravity of a vehicle causes the vehicle body to roll away from the corner. If the vehicle had zero bump camber, the heavily loaded outside wheel would haver the same angle to road as the vehicle roll angle. So if the vehicle rolls to 5 Degrees, the tyre would have 5 Degrees of positive camber. So negative camber gain is trying to minimise the positive camber to road experienced on the outside wheel during cornering to improve the tyre cornering power (tyres produce their maximum cornering power when they are perpendicular to the road). The lowered car now has +1.1 Deg/m bump camber. It is therefore adding additional positive camber on top of the vehicle roll induced positive camber so not a good situation for a vehicle chasing driving performance. In addition, wide low profile tyres, as often used on modified road and track cars, are more sensitive to camber angle than high profile narrow tyres further increasing the importance of bump camber.
Bump steer also sees a significant change between the baseline and the lowered car. The bump steer curve of the baseline vehicle is shown in Figure 5.

Figure 5. RACE Software – Baseline Report – Bump Steer
The baseline value of -6.8 Deg/m means that the wheel toe’s out as the suspension moves into bump. This is an understeer tendency on the front suspension of a car. The front outside wheel will steer away from the corner as the body rolls during cornering. The lowered car has almost double the bump steer of the baseline vehicle (-12.4 Deg/m) and will have more understeer as a result. This will deaden the response of the front suspension on turn-in compared to the baseline. The baseline value of -6.8 Deg/m is in the range that would be typically found on passenger car front suspensions, levels as high as -12.4 Deg/m would be much less common. One of the reasons being that high levels of bump steer can result in unwanted steering wheel rotation when the vehicle drives over single wheel bumps. This motion falls into the category of unwanted steering corruption.
The roll centre height sees a major change, going from 45mm above ground on the baseline (a normal place to be on a passenger car) to 90mm below ground on the lowered car (an abnormal place to be on a passenger car). To assess the impact of this drop, the change to the rear roll centre height with lowering would also need to be determined. Assuming it drops a similar amount, the distance between the vehicle roll axis (axis from the front roll centre to the rear roll centre) and the vehicle body centre of gravity will have increased significantly. This effectively reduces the ability of the car to resist roll when it experiences a lateral force during cornering. To maintain the same level of roll control during cornering, the lowered car would need larger front and rear anti-roll bars (resulting in degraded ride quality for single sided wheel inputs). This assumes the lowered car is not sitting on its bump stops/spring aids to support it in roll – more on this later.
Contact patch stiffness is a measure of the lateral stiffness of the suspension if it were measured at the tyre contact patch. A higher contact patch stiffness is generally desirable as it increases the response of the vehicle to driver steering inputs and the connection the driver feels with the vehicle. The lowered car shows a reduction in contact patch stiffness of approximately 8%. The drop is primarily due to the change in front view angle of the lower control arm in the lowered condition. The increased angle on the link mean that it is less efficient at reacting lateral (cornering) loads seen at the tyre contact patch.
Additional considerations
Although not captured in this analysis, the physically measured K&C data for this car shows that the front wheel will contact a spring aid at approximately 10mm of wheel travel. Spring aids (also known as a jounce bumpers or bump stops) are typically made from polyurethane foam. They are used to modify the wheel rate (the effective vertical stiffness of the suspension, measured at the wheel) of a vehicle as the wheel travels into bump for handling and load management reasons.
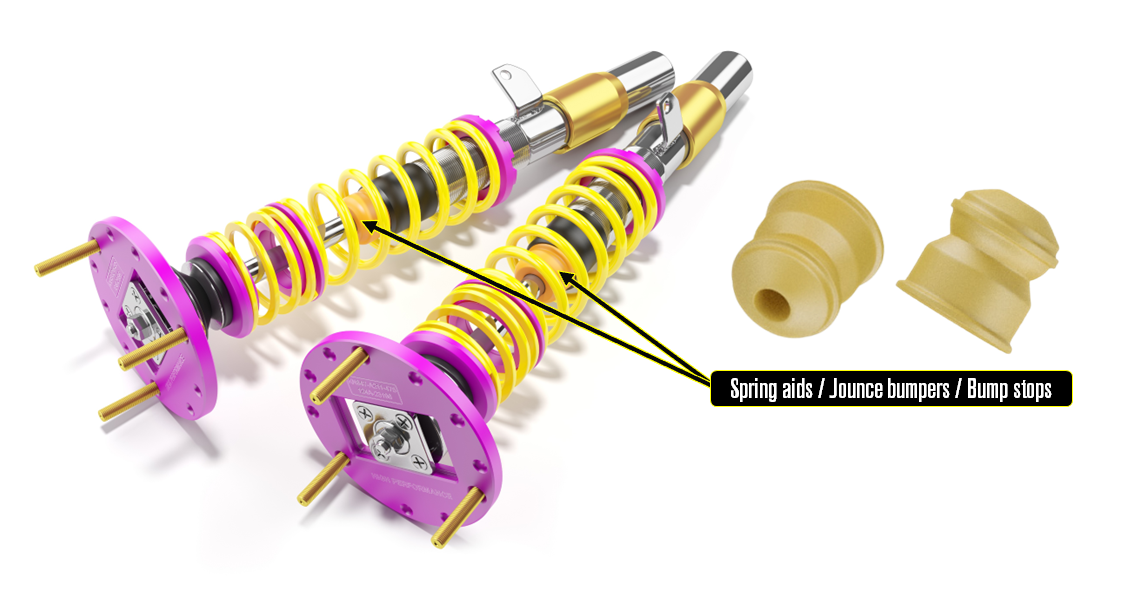
Figure 6. Suspension Spring Aids
The physical K&C data shows that the wheel rate approximately doubles after spring aid contact. This level of change, if it is not balanced with a similar change on the rear will noticeably modify the balance of the vehicle during cornering. The change will be in the understeer direction as it will increase the lateral load transfer on the front axle and reduce it on the rear. It will also result in a harsh ride compared to the unmodified car.
When lowered by 50mm, a significant portion of the cars wheel travel has also been lost. Small to mid size cars with MacPherson strut front suspensions would have somewhere between 70 and 85mm of total front bump travel. So the lowered car will have somewhere between 20 and 35mm of bump travel remaining. This reduces the ability of the suspension to absorb the energy of vertical impacts. It would be advisable not to hit any large kerbs, potholes or obstacles with this amount of bump travel!
So What Does All This Mean?
The logic given by some enthusiasts is that lowering a car will make it handle better because it lowers the centre of gravity. In isolation, this is indeed true. A lower centre of gravity, means less lateral weight transfer to the outside tyre during cornering and increases the cornering potential of the car (if all tyres share a more equal distribution of the total load, the tyres can generate a combined greater lateral force during cornering). The increased track width due to the wheel offsets/spacers also increases cornering potential for the same reason.
Looking at the suspension changes between the baseline and the lowered car, this argument is only part of the picture. Only the front suspension was included in this study, so the comments below only relate to the front suspensions contribution to the car’s driving performance. A complete front and rear suspension analysis would be required to make more concrete conclusions.
Assuming the car was re-aligned after lowering (to correct static camber and toe), the lowered car has almost double the front bump steer, positive front bump camber and a lower tyre contact patch stiffness. These changes contribute to a car which will have more understeer, reduced front suspension cornering capacity and reduced front suspension response to driver inputs. All are undesirable for anyone looking to improve the driving performance of their car. In addition, the car will have increased steering corruption from single wheel inputs (due to high bump steer), brake judder, torque steer, steering kickback and out of balance sensitivity (due to higher hub level offsets). This is not a major concern on a track car but this could be annoying for the driver on a road car.
The ride quality would be significantly degraded due to a doubling of the front wheel rate and also a lack of suspension bump travel to absorb energy from road inputs. Both of these also contribute to deteriorated and unpredictable handling on bumpy road surfaces. Next time you drive behind a heavily lowered car, watch the body motion as the car reacts to bumps in the road. The body motion will most likely be abrupt, harsh and erratic as the suspension hits the limits of its wheel travel. This is bad for ride quality and also tyre load variations over bumps which leads to poor handling. This would be very noticeable if the car hits a bump mid corner. The driver would feel the car skip laterally over bumps and it would not inspire confidence in the car’s handling.
How To Improve the Lowered Car
Using RACE Software the suspension changes required on the lowered car to correct the issues highlighted above are determined. Some are relatively simple to fix, others are more difficult and costly.
Starting with the simple ones, a full vehicle alignment after lowering the car is essential to correct the static toe. Shorter spring aids should be sourced for both the front and rear suspensions to ensure the wheel rate is controlled by the chosen springs. The shorter spring aids may be specified to allow a little more wheel travel, assuming the wheel and tyre package does not contact any part of the car at full bump or with steering lock.
The bump steer can be corrected by raising the steering rack by 5mm using shims. Alternatively, the tie rod outer ball joint can be dropped 5mm. This is the better solution (as it does not impact things like the steering column geometry and avoids moving the often tightly packaged steering system) but is more difficult to implement as it requires a modification to the knuckle.
For the remaining issues, the fixes start to get more complex and require custom fabricated suspension parts and body modifications. The roll centre height, bump camber and bump steer can be fixed by dropping the lower control arm ball joint by 50mm and dropping the tie rod outer ball joint by 41mm (if your chosen wheel size allows these changes). The result is a bump camber value of -11.7 Deg/m, a roll centre height of 40mm and a bump steer value of -6.2 Deg/m. This change also improves the contact patch stiffness beyond that of the baseline and gives a value of 1946 N/mm. All these changes are directionally beneficial compared to the original lowered car’s status.
The most difficult of all to fix is the wheel centre lateral offset. This would require keeping the same wheel offset (or not using spacers), but increase the length of the lower control arm and tie rod by 20mm and move the strut top outboard by 20mm.
Conclusion
This case study has highlighted some of the hidden changes that enthusiasts make to their suspension performance when they lower the ride height of their car or change the wheel positioning relative to the suspension. Although the well know benefits of a reduced centre of gravity and a wider track do indeed hold true, it has been shown that this is only part of the overall picture. Most of the hidden changes are directionally opposite to what is needed to improve the driving performance of the car. Unfortunately, the suspension changes required to completely fix some of the issues identified in this study are major and would require changing almost every component in the suspension with custom parts. There are however some fixes which are relatively easy to do and only require minor changes to the suspension system.
The changes discussed in this case study are applicable to the current generation European hatchback which was used in this study. The changes are not applicable to any other car. The best way to understand what is required on your car is to measure the positions of the suspension hardpoints and run a multibody simulation of the suspension. RACE Software’s cloud based multibody simulation package brings this automotive industry analysis capability to anyone interested in suspension analysis and development. RACE Software also offer courses for anyone looking to learn more about suspension and chassis systems and how to tune them.
Simulate Your Suspension!
You can start analysing and understanding different impacts on a suspension system and how this is applicable to your car by starting with a free trial of RACE Software by clicking HERE. All our software packages come preloaded with demo data and simulations for a number of suspension types used on current production vehicles, such as Double Wishbone, MacPherson, 5-Link, Control Blade, Push/Pull Rod Double Wishbone and Beam axles. Specialised and custom suspension types and analysis are available on request.
To learn more about different suspension KPIs and how to tune your suspension you can access our educational courses by clicking HERE.
